

Project Dashboard
This is a private project. If you would like to learn more details, access the source code, or experience the project, please contact jacky.
Published:
9 minute read
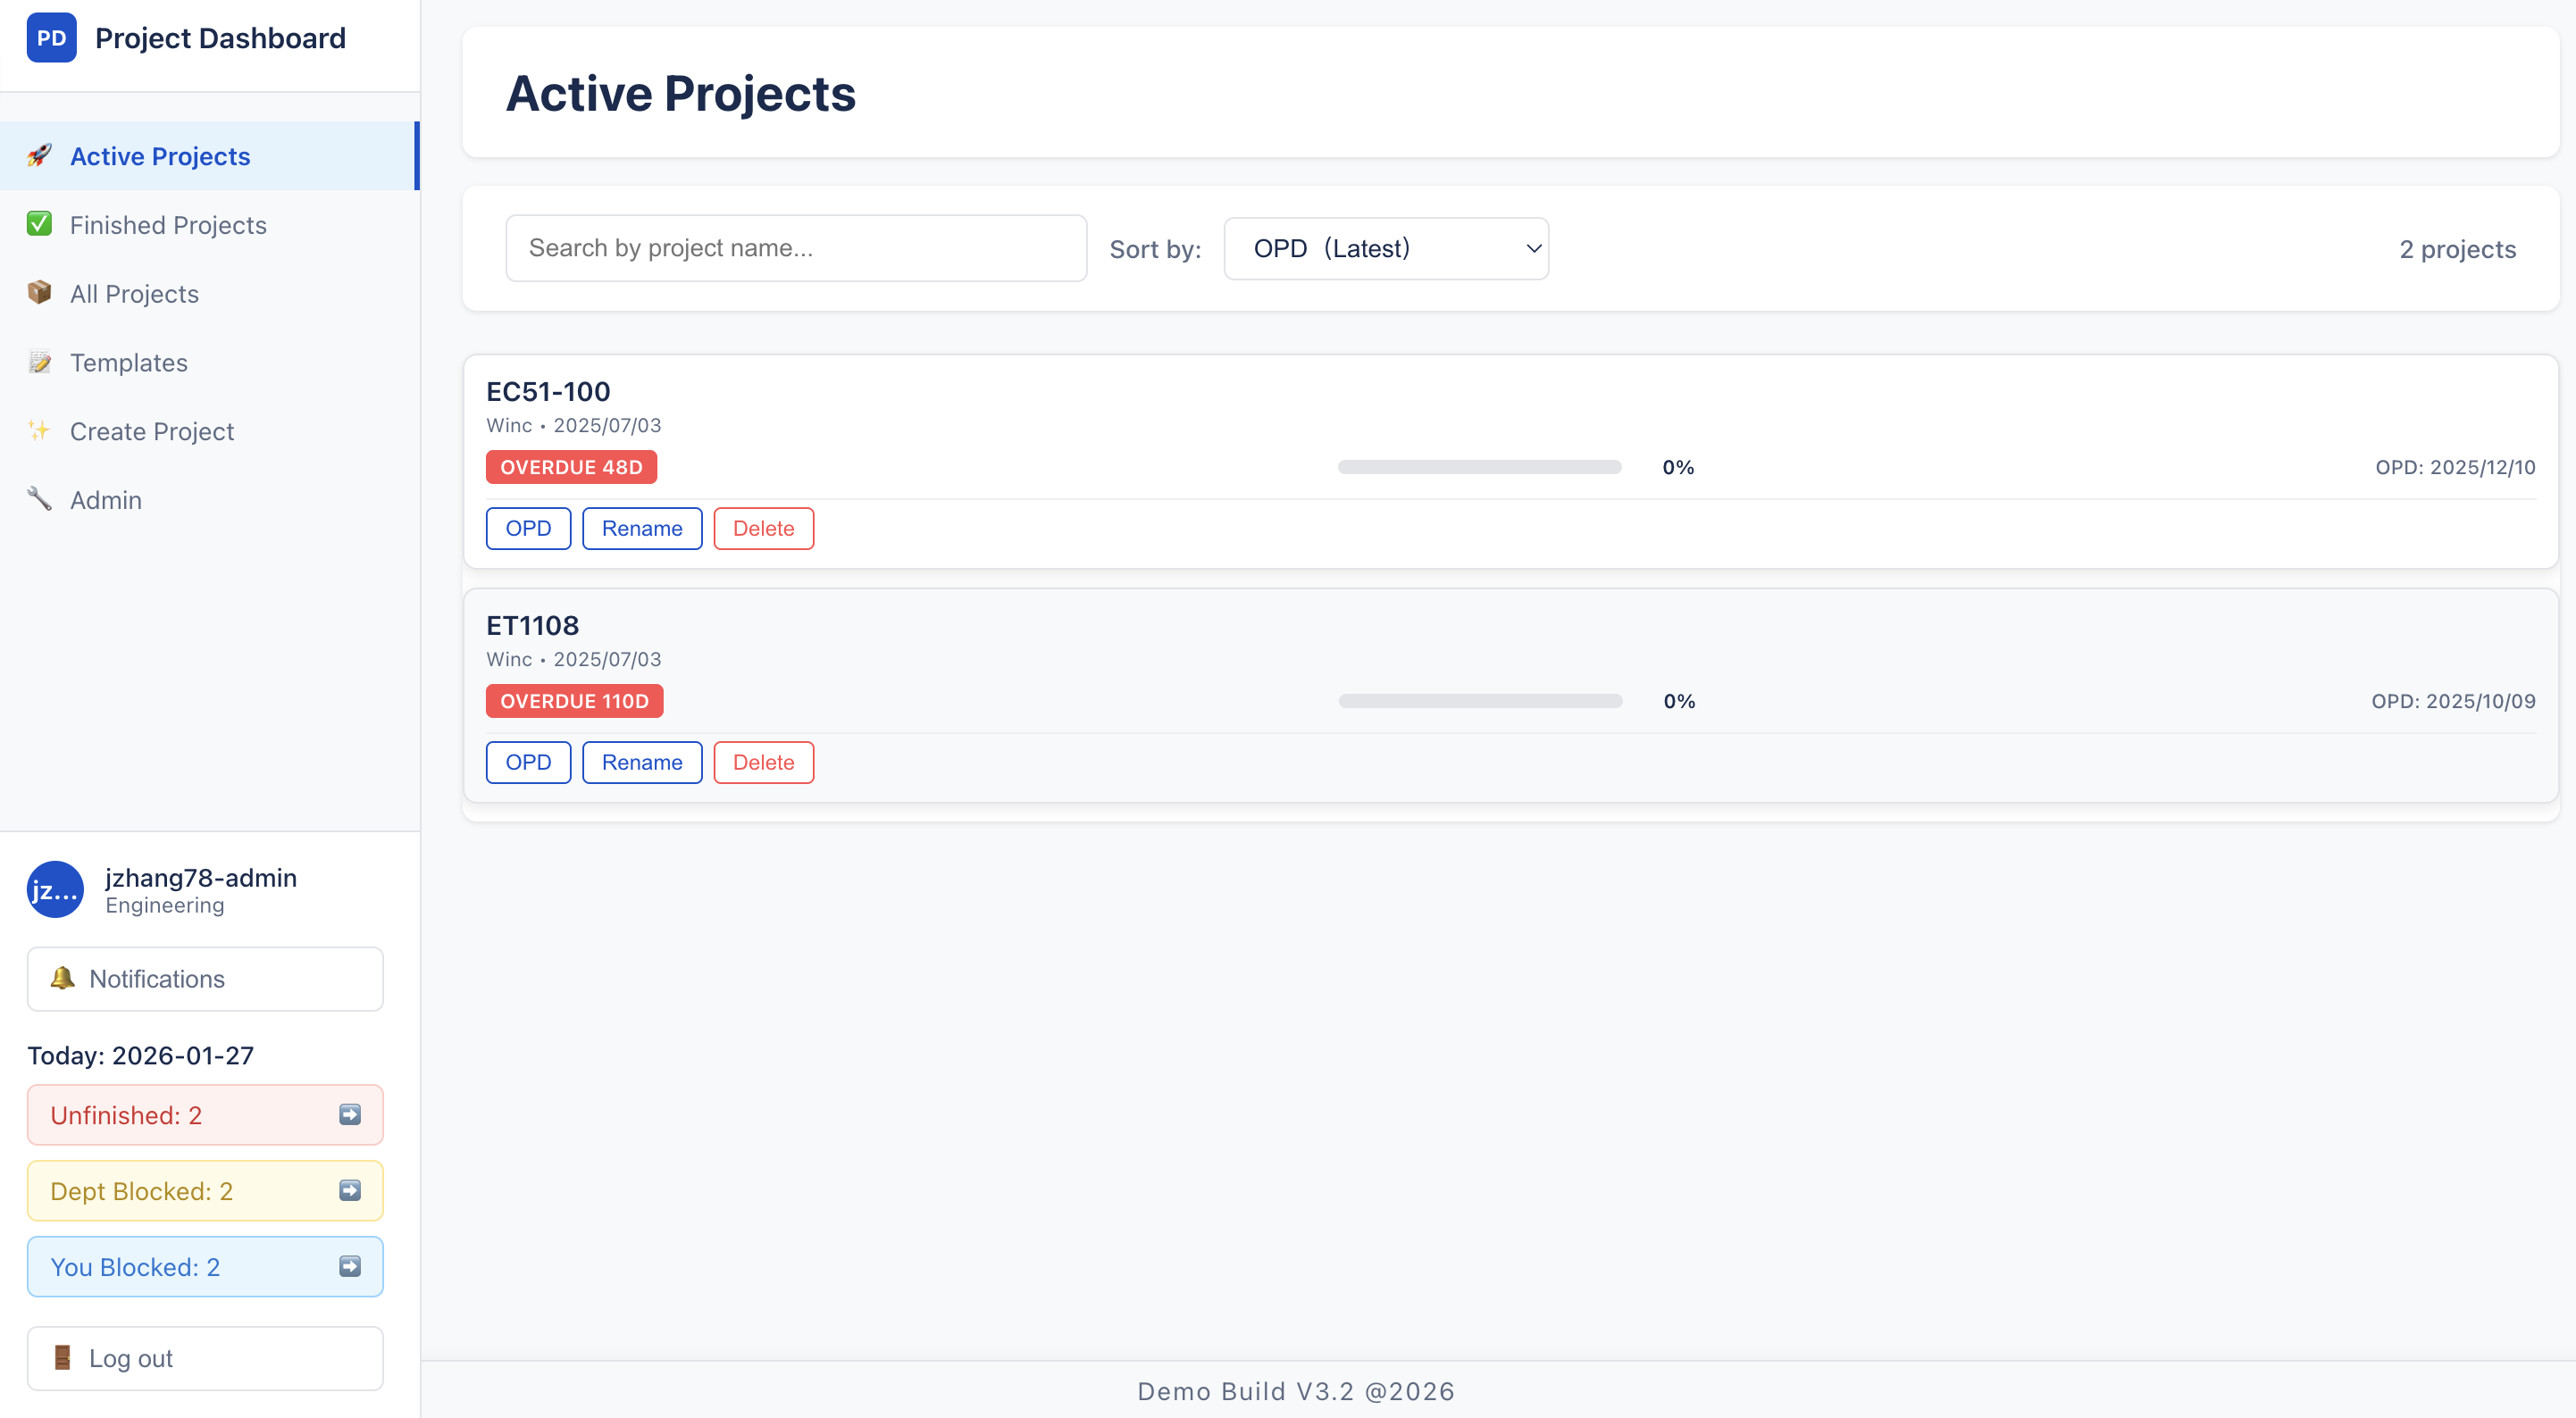
Project Dashboard: Active projects list (admin view)
In One Sentence
Project Dashboard tracks a customer order as it moves through Sales → Engineering → Production → Warehouse at a UK mechanical manufacturing company — with Kanban tasks, automatic progress roll-up, @mention notifications, and a single view of where every order is stuck.
The Problem
One order touches many teams. Spreadsheets and email threads make it impossible to see who is blocking what. Tasks get missed between departments. Managers lack a live view of progress, and there is no standard checklist when a new order arrives.
Eight Core Capabilities
1. Cross-Department Visual Workflow
Pain point: Nobody can answer "where is this order?" without calling three departments.
What Project Dashboard does:
- Project creation auto-spawns a Department Checklist for every department in the system (Sales, Engineering, Production, Warehouse, etc.).
- Visual workflow bar (
DepartmentFlowBar) renders departments in configurable order with colour states:- Gray — not started (0%)
- Orange — in progress (>0%, <100%)
- Green — completed (100%)
- User's own department highlighted with a blue dot; horizontal auto-scroll on mobile.
- All departments visible on every project — cross-department transparency from day one.
- Department order configurable by admin via drag-and-drop reorder.
2. Kanban Task Lifecycle with Permission Rules
Pain point: Generic task tools do not enforce who can move what, or require accountability when completing work.
What Project Dashboard does:
- Four columns per department: Unassigned → Todo → In Progress → Complete.
- Drag-and-drop state transitions with optimistic UI and server validation.
- Strict permission rules:
| Transition | Who can do it |
|---|---|
| Unassigned → Todo | Same-dept user or admin |
| Todo → In Progress | Assigned user only |
| In Progress → Complete | Assigned user only |
| Complete | Locked — cannot revert |
- Mandatory comment on completion — UI requires a comment before the complete API is called; creates an audit trail.
- Jira-style ticket modal — full timeline, comment thread with @mentions, edit title (assigned user, todo only).
- Lazy loading — checklist metadata loads first; items fetched per department on demand (user's department loads first); chunked API calls for performance.
- Bulk operations: add ticket, load template (replaces uncompleted items), delete uncompleted tickets (multi-select).
3. Automatic Progress Roll-Up
Pain point: Manual progress updates on spreadsheets are always stale.
What Project Dashboard does:
- Checklist progress = percentage of items with status
complete. - Project progress = aggregate across all department checklists.
- Auto-finish: when project hits 100%, status becomes
finishedandfinishedAttimestamp is set. - Recalculation triggered on every item status change — no manual refresh needed.
- Progress visible on project cards, workflow bar, and sidebar statistics.
4. Template System for Standardised Processes
Pain point: Every new order starts from scratch; teams reinvent the same checklist.
What Project Dashboard does:
- Department checklist templates — admin creates reusable item lists per department (unique name per dept).
- Default templates — one default per department; auto-applied when a new project is created.
- Template Manager page — grouped by department; create/edit/delete items; set as default; admins can manage any department's templates.
- Load template on existing project — replaces all uncompleted items in target department with template items (destructive but intentional for reset).
- Create Project confirmation shows per-department default template preview before submission.
5. @Mention Notifications
Pain point: Comments in task threads do not alert the people who need to act.
What Project Dashboard does:
@usernamein task comments triggers instant in-app notification to mentioned user.- Strict validation:
@in text must matchmentionedUsersIDs; mentioned users must belong to a department on the project. - Notification centre in sidebar — badge with adaptive polling (10s active / 30s idle); infinite scroll panel (10 per page).
- Click notification → navigate directly to the project and task.
- TTL storage — read notifications auto-expire after 90 days (MongoDB TTL index).
- Unread count endpoint for badge accuracy.
6. Three-Level Statistics Dashboard
Pain point: Managers need different views — company-wide bottlenecks vs personal blockers.
What Project Dashboard does:
Three clickable metric cards in sidebar, polled every 2 minutes:
| Metric | Meaning |
|---|---|
| Unfinished Projects | Count of in-progress projects globally |
| Dept Checklists | User's department checklists with progress < 100% on active projects |
| Blocked by Me | Active projects where user has assigned todo/in-progress items in their dept |
- Clicking opens a lazy-loaded detail modal with project names, progress percentages, and blocked item counts.
- Links navigate directly to project detail.
- Gives every user a personalised "what needs my attention" view without building separate reports.
7. OPD (Original Plan Date) & Delivery Tracking
Pain point: Orders without visible deadlines drift; urgency is invisible until it is too late.
What Project Dashboard does:
- OPD field on every project — expected delivery date set at creation or later.
- Urgency badges on project cards:
- Green — more than 10 days remaining
- Orange — 10 days or fewer
- Red — overdue
- Gray — no OPD set
- Default sort on Active Projects page: OPD ascending (earliest deadline first); null OPD sorts last.
- Finished projects show duration instead of OPD.
- PDF report includes OPD, remaining days, and on-time completion analysis.
8. Admin Tools, Filtering & PDF Export
Pain point: Admins need user/department management, flexible project views, and exportable reports — not just another task board.
What Project Dashboard does:
Admin panel
- User management — view all users with department assignment and search.
- Department management — add, rename, drag-reorder workflow sequence.
- Admin management — add/remove admin users by username.
- Elevated capabilities: create/delete projects, set OPD, load templates in any department, generate PDF reports.
Project list filtering
- Active / Finished / All / Starred pages with server-side status filter.
- Search by project name (debounced regex, paginated 30/page).
- Sort by OPD, creation date, or progress (persisted in localStorage).
- Starred projects — personal watchlist with optimistic bookmark toggle.
Project detail filtering
- Department chips — multi-select; triggers on-demand item loading.
- Search box — title text or
@assigneewith user autocomplete scoped to project. - Default: user's own department pre-selected.
PDF report (admin only)
- Client-side generation via
html2pdf.js(A4 portrait). - Sections: project metadata, department completion bar chart, time efficiency analysis, per-department checklist tables with assignee and duration.
- Filename:
{projectName}-项目报告-{timestamp}.pdf.
Real-World Impact
Currently in production at a UK-based mechanical manufacturing company. Replaced manual spreadsheet tracking with a live system used daily across Sales, Engineering, Production, and Warehouse. Same enterprise client as Product Scanner.
Skills Demonstrated
| Area | What this project shows |
|---|---|
| Enterprise delivery | Production B2B workflow system with real daily users |
| Process design | Multi-department Kanban, auto progress, template seeding |
| Full-stack | React 19 + Node.js/Express + MongoDB/Mongoose |
| Collaboration | @mentions, notification centre, department-scoped permissions |
| Admin tooling | Templates, department reorder, PDF export, OPD management |
How It Works (Plain English)
- Sales creates a project (optionally from default templates, sets OPD).
- Each department works through its Kanban checklist — assigns tasks, adds comments, @mentions colleagues.
- All items in a department complete → progress rolls up; project auto-finishes at 100%.
- Sidebar statistics show company-wide, department, and personal bottlenecks.
- Admins manage users, departments, templates, and export PDF reports.
Architecture
┌─────────────────────────────────────────────────────────┐
│              Web Dashboard (React · GitHub Pages)          │
│   Projects · Kanban · Notifications · Admin · Reports   │
└────────────────────────────┬────────────────────────────┘
                             │ HTTPS + JWT (24h)
┌────────────────────────────▼────────────────────────────┐
│              API Server (Node.js · Azure/Railway)          │
│   Users · Projects · Checklists · Templates · Notify    │
└────────────────────────────┬────────────────────────────┘
                             │
                    ┌────────▼────────┐
                    │     MongoDB      │
                    │ 9 collections    │
                    └─────────────────┘

Workflow: Sales → Engineering → Production → Warehouse → Complete
Tech Stack
- Frontend: React 19, React Router 7, Context API, Axios, @hello-pangea/dnd, Day.js, html2pdf.js, GitHub Pages
- Backend: Node.js 18+, Express, MongoDB, Mongoose, JWT, bcrypt, compression
- Deployment: Azure Cloud Services / Railway (API), GitHub Pages (frontend)
Built for "where is this order stuck?" — not another generic project tool.